
Lesson
C1 · Advanced
Reading
How Sure Can We Be About This Claim?
Compare two fictional surveys, complete twelve evidence-and-certainty checks, and write a proportionate 130–160-word findings summary.
9 min read
1,465 words
Updated Nov 6, 2026

On this page (4 sections)
Read critically, then write precisely
You are editing a short report about a fictional reading room. Two surveys offer useful information, but their samples and measures differ. Read both before judging a claim. Your task is to distinguish recorded findings from possible explanations and future expectations. Allow about forty minutes for reading, twelve checks and a 130–160-word synthesis.
All names, surveys and numbers in this lesson are fictional teaching material. They are not evidence about an actual community. You may state the given counts confidently while limiting what they imply. A cautious summary should still tell the reader what was learned; it should not replace every conclusion with ‘we know nothing’.
Two fictional survey summaries
Survey A: the reading-room pilot
The fictional Westbridge Reading Room tested later opening on four Thursdays in May. Staff invited visitors at the desk to complete a voluntary questionnaire. Forty people responded, and twenty-six said that the later closing time was useful to them. Eighteen respondents said they had visited after six at least once during the pilot. The questionnaire did not record the views of people who never entered the building. It also did not ask whether visitors would use the later hours in winter. Staff counted an average of fifteen evening visitors on the four pilot dates, but they had no comparable counts for earlier Thursdays. Two dates coincided with a local arts festival. The report describes the responses and attendance counts; it does not isolate the effect of later opening from other influences.
Survey B: the neighbourhood questionnaire
A separate community group posted an optional online questionnaire in June. Sixty residents responded. Thirty-four selected later reading-room opening as one of several improvements they would welcome. Respondents could choose more than one improvement, and free workshops received thirty-eight selections. Twenty-two respondents said they expected to use the reading room more often if it opened later. The survey collected intentions, not subsequent bookings or visits. It was shared through the group’s mailing list and social-media page, so residents who did not use those channels may be underrepresented. The organisers did not check whether any respondents had also completed Survey A. The two surveys therefore cannot simply be combined into a count of one hundred different people. Both offer useful local feedback, but neither was designed as a representative sample of all Westbridge residents. Their results should therefore be interpreted separately. Neither questionnaire collected detailed information about travel distance, working hours or the reasons why some residents did not visit the reading room.
A framework for checking each claim
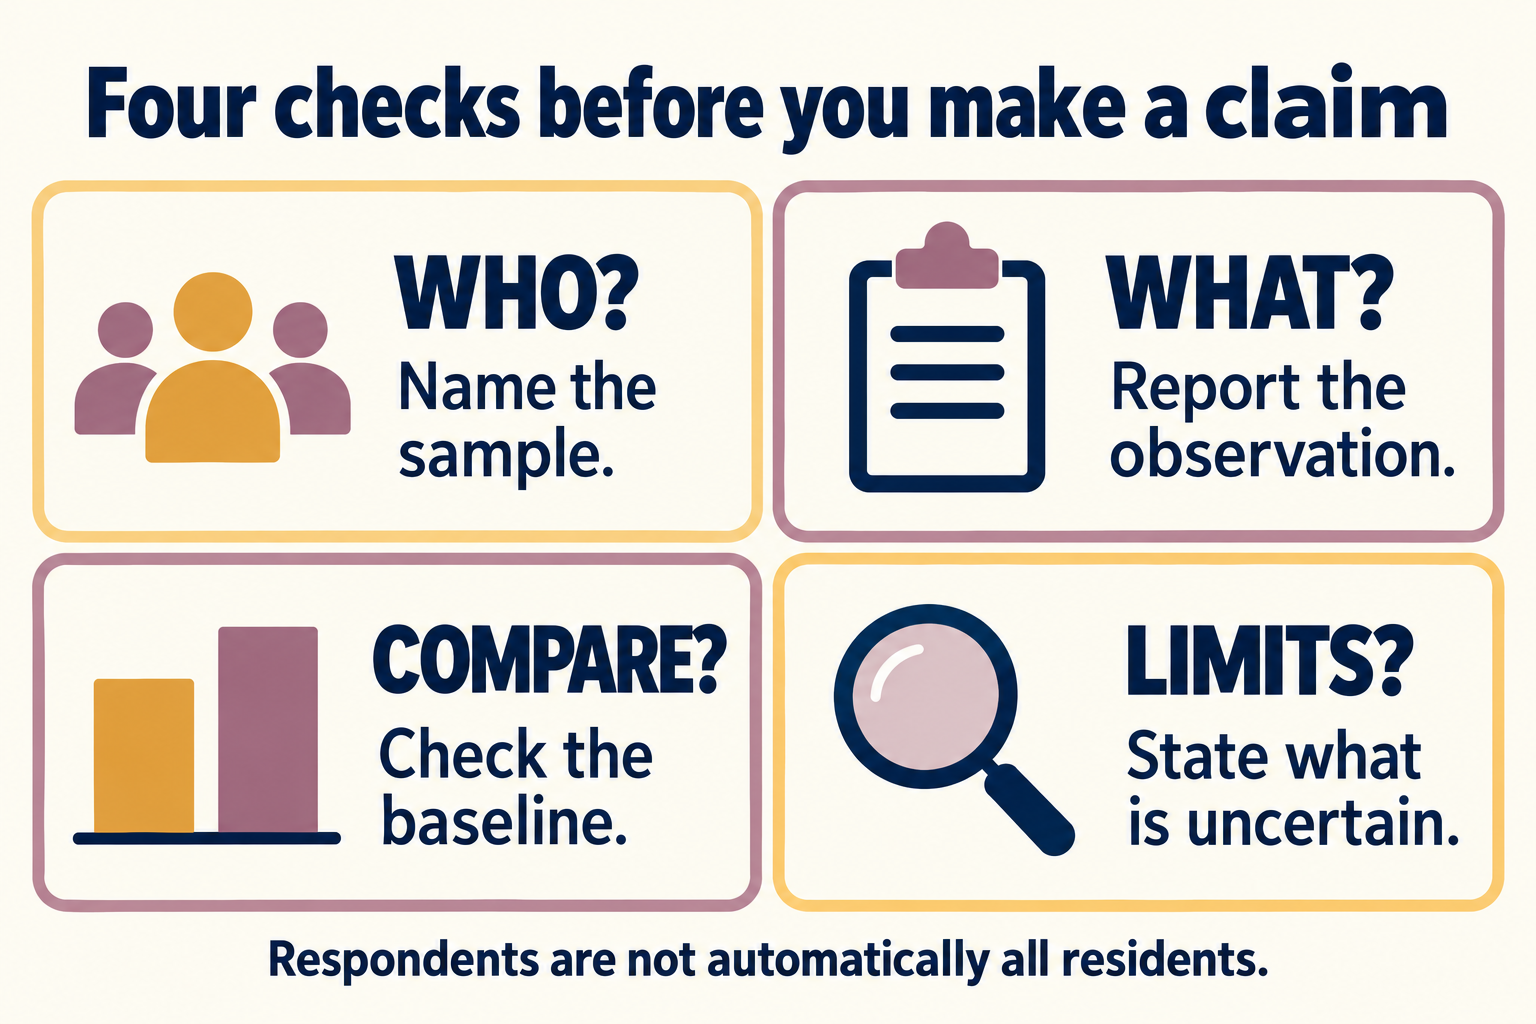
Ask four questions: Who was measured? What was actually recorded? Which comparison is available? What remains uncertain? Highlight population words such as visitors, respondents and residents. Check causal verbs such as caused or proved. Mark future claims separately from past reports. The instructional image shows the same four checks; none is a numerical probability score.
Practice tasks
Try each item before opening the answer. Read the explanation even when your answer is correct.
Answer on paper, then open the explanations below. Enable JavaScript to check answers here.
Your turn · self-review
Apply it and compare
Write or say your own answer first. The models are examples, not the only acceptable answers. Use the checklist to review your work; open responses are not automatically assessed.
Practice only. Your writing stays on this page; it is not submitted or saved.
-
Model answer and explanation
The two fictional surveys suggest some local interest in later reading-room opening, although their findings should be kept within scope. In Survey A, twenty-six of forty respondents found the later closing time useful, and eighteen reported visiting after six during the pilot. These results describe participating visitors, not all residents. Survey B also recorded interest: thirty-four of sixty respondents selected later opening, while free workshops received more selections. Twenty-two said they expected to visit more often, but stated intentions do not establish future attendance. The evening counts in Survey A cannot demonstrate an increase because comparable earlier counts were unavailable, and the arts festival may have influenced attendance. The surveys should not be merged into one hundred unique respondents because overlap was not checked. A longer trial with comparable attendance data and broader recruitment would provide a firmer basis for a decision.
-
Model answer and explanation
Self-check: 130–160 words; no combined claim of one hundred unique people; counts and sample labels accurate; intentions distinguished from behaviour; no unsupported causal proof; no fixed probabilities assigned to may or might; a useful conclusion remains. A defensible alternative may recommend a trial or better measurement, but it should not pretend the decision is compelled by these surveys.
Related Lessons






Continue learning this topic
Review an explanation, study examples or try a related practice test.
- Practice test At the University of Maryland, a historic campus farm remains a classroom — C2 English Listening Practice Test
- Practice test At the University of Maryland, a historic campus farm remains a classroom — C2 English Grammar Practice Test
- Practice test At the University of Maryland, a historic campus farm remains a classroom — C2 English Vocabulary Practice Test