
Interpreting Feedback Paths in a District Energy Network
About this practice test
A technical training diagram and explanatory passage trace how a district energy network produces, measures, distributes, stores and regulates heat through interacting feedback paths.
What you’ll practice
Finding detail
Locate specific information and evidence.
Interpreting ideas
Connect main points and inferences.
Evaluating arguments
Assess claims, evidence, and limitations.
What to expect:
1 question with explanations to review after submission.
Study the questions and tasks
Work through the material below, or start the interactive practice above to complete an attempt. Try the exercises before opening any answer or transcript sections, then use them to review your work.
- Practice level
- C2. Try this level if you can follow the instructions and understand most of the language; choose an earlier level if you need more support.
- Question formats
- Label the image
How to approach this practice
Read the passage for its main idea, then return to the relevant sentence or paragraph for each question. Base answers on the passage.
Interpreting Feedback Paths in a District Energy Network
 region-1
region-2
region-3
region-4
region-5
region-6
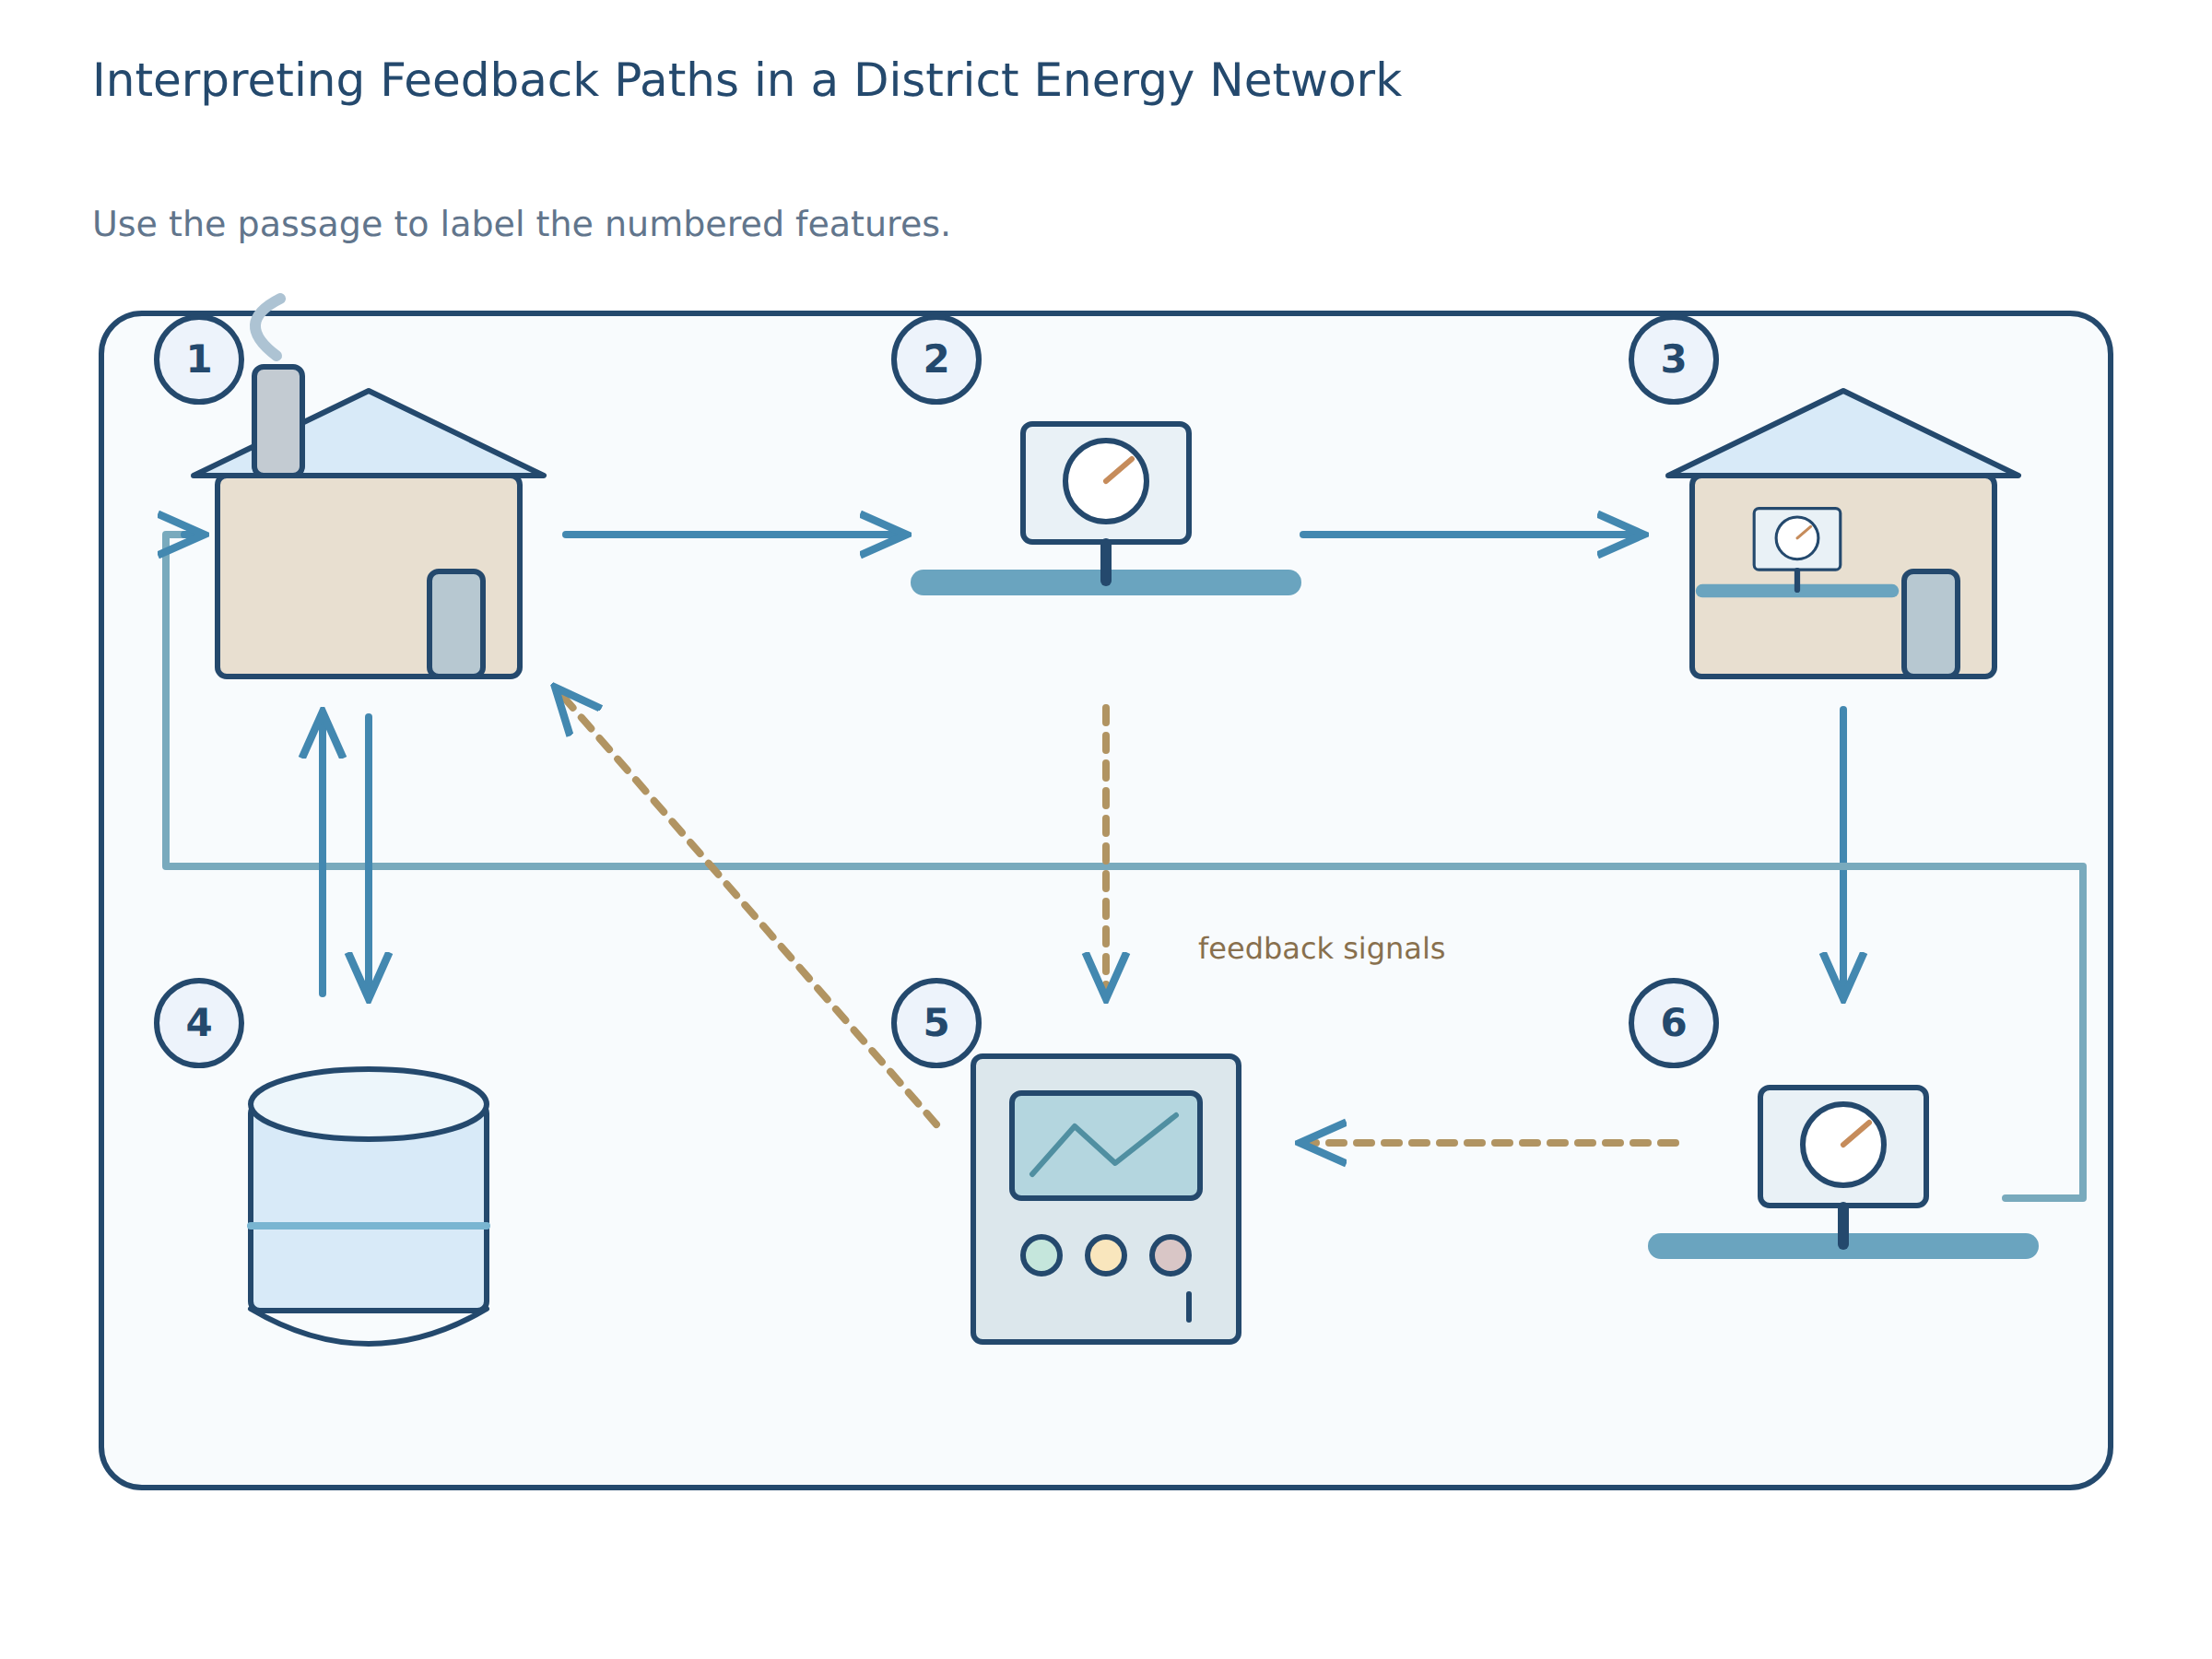
In Mira’s training room, the district energy network is presented as a conversation rather than a line of pipes. Heat moves out, readings move back, and the control logic keeps revising itself. The value of the model is that it makes the invisible legible: the city is always negotiating with itself. A system can look calm on a screen while quietly compensating for demand, storage, weather, and timing. What matters, then, is not only where the water goes, but which signals are trusted when the system decides what to do next. The heat plant sits in the upper left of the schematic. It is the point where low-grade heat is lifted to a useful temperature, but the plant does not behave like a ruler issuing commands. It is more like a musician waiting for a cue: the network tells it what the city actually needs. The plant begins the loop at a stable temperature and then hands control to the measurements downstream, because the network is designed to correct itself instead of simply pushing more heat whenever that seems convenient. At the upper centre, a supply sensor checks the water as it leaves the plant. The reading matters because the plant can be efficient on paper and still underperform if the supply arrives too cool for the buildings. In the upper right, the district substation stands for the cluster of consumers. Here, heat is handed over through exchangers, valves, and branch pipes, so the demand is not one number but many small decisions made at once. Some branches draw heavily, some only intermittently, and some are almost idle except for the hours when the weather turns. The apparent neatness of the loop ends at the lower right. At the lower right, a return probe reads the water after it has passed through the district substation. A warm return is not simply "more heat left over"; it often means the buildings have not extracted enough energy, or a bypass has stayed open too long. The operator therefore treats the return reading as a diagnostic, not a verdict. It is a clue about balance, not a moral judgment on the system. Lower left, a thermal store holds hot water for the hours when the plant would otherwise have to chase a brief surge. The store is not a backup only for emergencies. It lets the network move energy out of the way when prices, demand, or grid conditions make it sensible to do so, then move it back when the evening rush begins. In practice, this means the system can remain steadier than the city demand itself, absorbing irregularity instead of amplifying it. The control hub in the lower centre receives both temperature signals and decides whether to speed the pumps, open a valve to storage, or ease the supply target down. It is here that feedback becomes policy. The hub is not asked to be clever in the abstract; it is asked to prevent the familiar cycle in which a system overcorrects, cools too much, then races to recover. The best control action is often the least visible one, because it keeps the loop stable enough that nobody notices a correction was needed. Mira, who trains new technicians in the district office, prefers to explain the loop in plain language. Heat goes forward, evidence comes back, and the next action is chosen from the evidence, not from habit. On a mild afternoon the hub may lower output even while the plant is healthy, because the buildings need less. On a cold evening it may do the opposite, not because the plant is failing but because the city is speaking more loudly. The point is that the same machine can behave differently without becoming inconsistent. For new trainees, Mira draws a second line beside the first and asks them to trace not the pipework but the decisions. They mark where the reading is taken, where the return becomes useful, and where storage delays an unnecessary correction. This habit matters because a district system can be technically efficient and still be badly interpreted. A diagram that separates movement from meaning helps the operator notice which piece of information should dominate at a given moment, and which piece should merely keep watch in the background. This is why the network is described as a feedback path rather than a mere route. A route only delivers; a feedback path interprets. If the supply is too high and the return too warm, the hub can trim the target or lean on storage. If the supply is adequate but the return suggests waste, the issue may lie in a valve, a timing schedule, or a branch that is serving a nearly empty block as though it were full. A controller that ignores the return data may still keep the buildings warm, but it will do so wastefully and often unevenly, which is why the feedback loop matters more than sheer output. There are, however, limits to what the diagram promises. Not every anomaly points to the same cause, and not every correction should be immediate. A sensor can drift, a storage tank can be partially charged, and a building may have unusually intermittent occupancy. Good control therefore requires patience as well as speed. Engineers distrust neat graphs that pretend every spike has a single cause, because real districts mix weather, occupancy, storage state, and equipment wear. The purpose of the network is not to force every line to look tidy on a screen; it is to keep the city comfortable with as little wasted heat as possible. Read the diagram as a story of interdependence. The upper left initiates supply, the upper centre and upper right reveal what is really being delivered, and the lower right, lower centre, and lower left show how the system learns from the journey. Once that is understood, the labels stop being mere names and start describing a logic: production, measurement, demand, storage, interpretation, and return. The scheme is not just a map of parts; it is a map of decisions.
-
Question 1 · Label the image
Match the labels to the marked regions of the image.
Read the passage and choose the correct label for each numbered part of the diagram.
Return to the passage, recording or visualImage labels
supply sensor · district substation · thermal store · control hub · return probe · weather forecast node · heat plant · billing server
Label regions region-1, region-2, region-3, region-4, region-5, region-6 marked on the image above.
Check answers and explanations
- Region region-1
- heat plant
- Region region-2
- supply sensor
- Region region-3
- district substation
- Region region-4
- thermal store
- Region region-5
- control hub
- Region region-6
- return probe
Label 1: Heat plant — the passage places it in the upper left and describes it as the point where low-grade heat is lifted to a useful temperature. Label 2: Supply sensor — it is in the upper centre and checks the water as it leaves the plant. Label 3: District substation — it is in the upper right and represents the cluster of consumers where heat is handed over. Label 4: Thermal store — it is in the lower left and holds hot water to absorb surges and shift energy through time. Label 5: Control hub — it is in the lower centre and receives temperature signals before deciding how to adjust the system. Label 6: Return probe — it is in the lower right and reads the water after it has passed through the substation. The weather forecast node and billing server are not assigned to any numbered region.
The heat plant sits in the upper left of the schematic
At the upper centre, a supply sensor checks the water as it leaves the plant
The control hub in the lower centre receives both temperature signals and decides whether to speed the pumps, open a valve to storage, or ease the supply target down
What to review next
Find the words that support each answer. For a mistake, compare the question with the evidence and identify the detail or inference you missed.
A focused practice result shows how you did on these tasks. Use several activities across skills to decide what to study next; one practice score does not certify an overall CEFR level.
Before you practise: a worked example
Look for evidence in the text. Separate what the writer says from what you already know about the topic.
The library normally closes at six, but on Fridays it stays open until eight. When does it close on Friday?
The answer is eight. But introduces an exception to the normal closing time, so the first time mentioned is not the answer.
This teaching example is separate from the scored questions. After your test, compare any mistakes with the explanation and revisit the topic before trying again.